
Inside the “Zelensky Moment”: What European Investment Patterns Reveal About Geopolitical Risk
Beneath the surface of political messaging, deeper patterns reveal how history and geography shape the way risks are perceived across Europe.
“Why do investors in Europe respond differently to similar geopolitical events? While prior research shows that geopolitical risk affects asset allocation, little is known about how awareness of geopolitical risks varies across countries and investor types. We examine this question by analyzing European investors’ reactions to rising tensions in Ukraine following Volodymyr Zelensky’s election in 2019, using detailed data from the European Central Bank on holdings of international defense stocks across 26 European countries from 2010 to 2025.” This is how the study titled “The Zelensky Moment: Investments in the Defense Industry and Geopolitical Risk Awareness of European Investors” begins.
The study was published in March this year and authored by Martijn Boermans, Rients Galema, Auke Plantinga, and Bert Scholtens.
The importance of this research lies in introducing a new way of measuring geopolitical risk. The study shows that historical memory and geography play a crucial role in how we process information about security threats. For policymakers, this sends a clear message: citizens’ portfolios can serve as an “early warning signal” of geopolitical instability that official institutions may still be overlooking or underestimating.
We spoke with the lead author of the study, Dr. Auke Plantinga from the University of Groningen.
A threat in the air
To obtain precise insights, the researchers used data from the European Central Bank (ECB), analyzing the behavior of investors from 26 European countries over the period from 2010 to 2025. This allowed them to compare conditions “before” and “after” key events. Investments in defense industry stocks (weapons and military equipment) serve as a direct indicator of awareness of geopolitical risk. The authors hypothesize that investors who are geographically closer to the conflict or have historical experience with Soviet domination respond more quickly and more intensely than those in Western Europe.
Results: The “Zelensky Moment” as a turning point
The study identifies 2019 and the election of Volodymyr Zelensky as President of Ukraine as a turning point, the so-called “Zelensky moment.” Although he was an unconventional candidate, his victory drew global attention to Ukraine, but different parts of Europe interpreted this event in distinct ways.
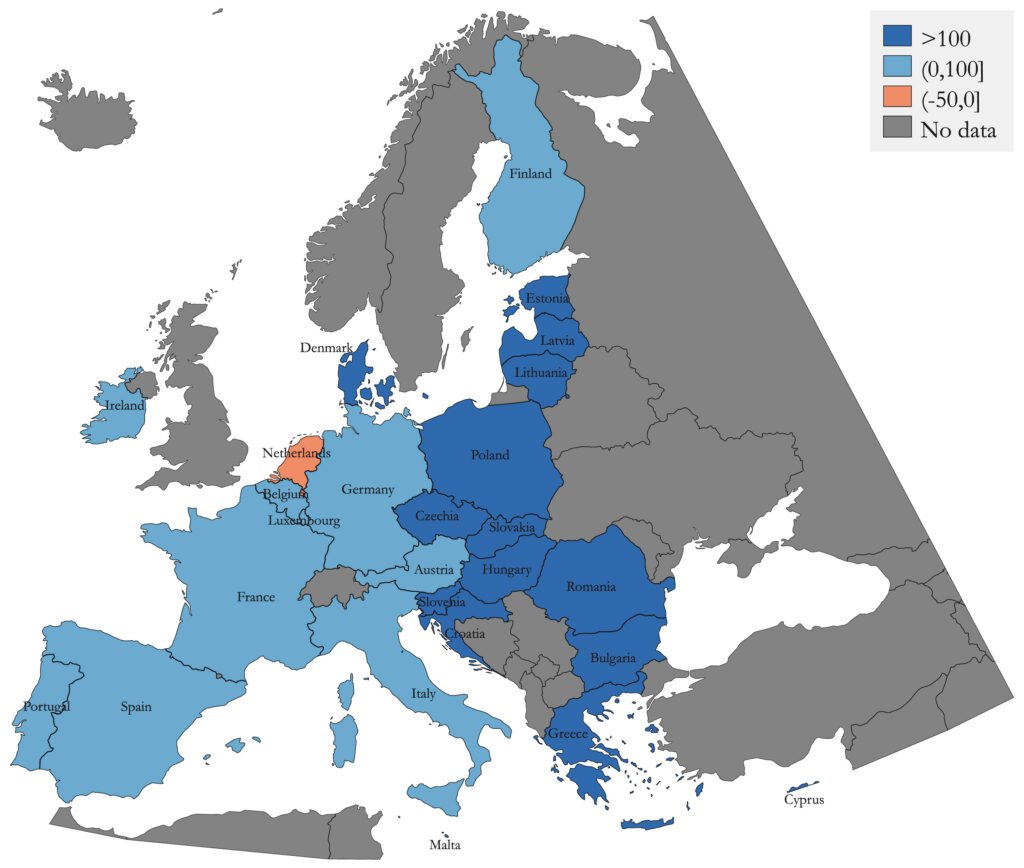
Investors from countries with a Soviet past (the former “Iron Curtain”) significantly increased the share of defense stocks in their portfolios immediately after 2019. This effect was most pronounced among small (retail) investors. While large institutions, such as pension funds, hesitated due to ethical (ESG) restrictions on investing in weapons, individual investors in regions closer to the conflict intuitively recognized the growing risk. The closer a country is geographically to Ukraine, the faster and stronger the market response.
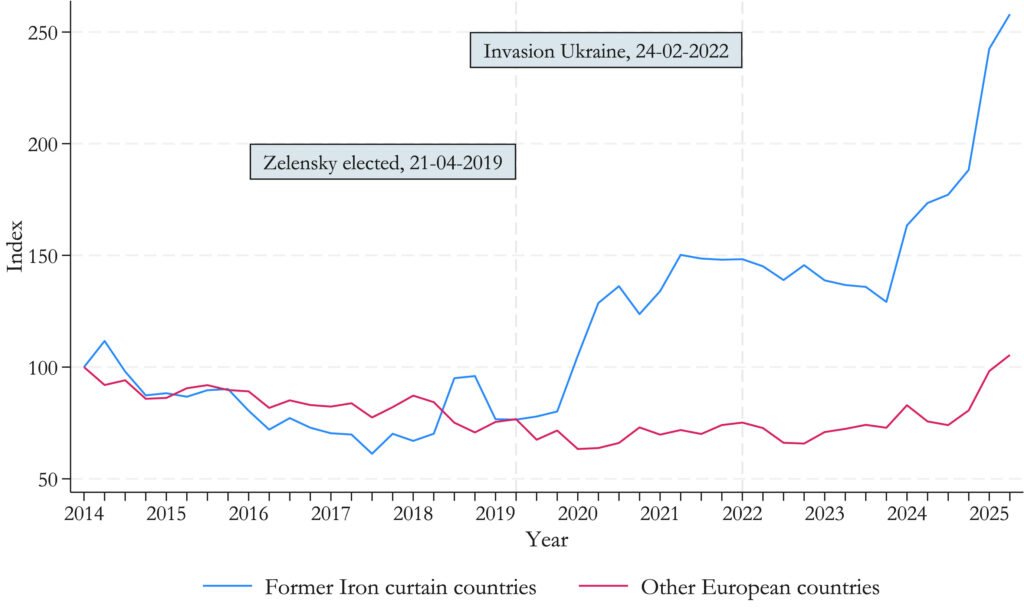
This figure shows the total investments in defense stocks each quarter, scaled by their total market value for two groups: Former Iron Curtain countries (Bulgaria, Croatia, Czech Republic, Estonia, Hungary, Latvia, Lithuania, Poland, Romania, Slovakia, Slovenia) and all Other European countries in their sample. For comparability purposes, both time series are indexed such that 2014Q1 equals 100.
There is a strong interaction between financial markets and geopolitical risk going in both directions
How did you come up with the idea for this study?
Auke Plantinga: The idea came from our access to the database of the ECB, which reported country-based aggregates that showed clear patterns in summary statistics pointing towards more defense stocks in countries in Eastern Europe. We also knew that a lot of institutional investors (pension funds) exclude defense stocks from their portfolios, so we wanted to study this further.
In a world where geopolitical events are becoming increasingly frequent and unpredictable, financial markets react to political changes. How much influence do media coverage, public statements, and trust in politicians and institutions have in this process? It seems that your study also raises additional questions, for example, whether politicians’ speeches can create a stronger sense of insecurity.
Auke Plantinga: This is a good question. There is a strong interaction between financial markets and geopolitical risk going in both directions. Obviously, financial markets are concerned about geopolitical risks, which may have a tremendous impact on economic growth, trade flows, and asset prices. Some people also suggest that Trump revert to previous policy actions in response to the negative market reactions. From the study of noise in financial markets, we know that noise can move financial markets. Likewise, noise created by politicians in the form of war mongering can itself inflate geopolitical risks and risk perceptions by financial markets.
The Zelensky moment is really a unique event
You use the term “Zelensky moment” as a turning point in geopolitical risk perception. Do you think this approach could be used to track market reactions to future political elections and leadership changes?
Auke Plantinga: The Zelensky moment is really a unique event because Zelensky, being a comedian and actor by profession, was a very unusual candidate for the presidency. This created a lot of worldwide attention for the Ukrainian elections. Not all geopolitical events share this property. We do expect that using the percentage of defense firms in stock portfolios is a valid indicator of geopolitical risk perception. In comparison with newspaper articles counts or opinion surveys, decisions to buy stocks are not without consequences. By investing money in their opinions, investors think twice because they can also lose money.
What surprised you the most in your results, especially regarding differences between countries and types of investors? Which finding opened up new questions for further research?
Auke Plantinga: Our main finding was surprising. Individual investors in former Iron Curtain Countries started investing in defense stocks in a very early phase of the conflict, when the Donbas was the battleground between local insurgents and the regular Ukrainian forces. They already must have sensed that the conflict was not just a local issue, as many in the West may have believed. Another surprise was that individuals and institutions behave very differently. Individuals seem to have been more responsive to these geopolitical tensions, while institutions were struggling with the question of whether defense stocks should be included or excluded as part of their ESG policies.
We believe that policymakers should include the percentage of defense stocks held in the portfolios of private individuals as a measure of geopolitical risk awareness
Since the study shows descriptive patterns rather than strict causal effects, how would you like these findings to be used in practice? Can they influence how investors or policymakers think about geopolitical risk?
Auke Plantinga: We believe that policymakers should include the percentage of defense stocks held in the portfolios of private individuals as a measure of geopolitical risk awareness. Politicians typically like to cut spending on defense because other social issues tend to crowd out geopolitical concerns. Think of the pressure to spend more on public health care, education, social security, etc.
In your view, how important is the psychological factor in explaining the differences between countries closer to and further from Ukraine? Could this type of analysis also contribute to a better understanding of diplomatic and political behaviour between states, and potentially help in preventing conflicts?
Auke Plantinga: Psychology is a broad concept which includes perception and awareness. What we did not investigate was the impact of the past experiences of people in the former communist countries, which might have been affected by the influence of the Soviet Union as a predecessor of the current Russia. Although the general picture is a mixed bag, many have negative experiences with political repression, censorship, lack of freedom, shortages, and queuing outside stores, and Soviet military control. These feelings may differ per country and would be interesting to investigate further. Past experiences show that relations between countries with prior conflicts improve when conflicts end not just with a peace treaty or a power transfer but also with a process of reconciliation.
What do you think is the most important message of this study for Europe in the broader political and security context?
Auke Plantinga: European security and political unity benefit when Europeans share the same beliefs and opinions about geopolitical risks.
Limitations and Future Research
As in all research studies, the authors in this case also highlighted limitations, while also providing directions for future research.
As the authors noted, their analysis is based on group-level investor data (i.e., investor–sector–country combinations), which prevents identification of responses at the individual level or direct measurement of beliefs and motivations. Second, institutional constraints, such as exclusions due to Environmental, Social, and Governance (ESG) considerations, may limit defense-related investments in some countries, potentially attenuating the observed effects. Third, while the study focuses on Europe and the Russia–Ukraine conflict, other global geopolitical developments during the sample period may also have influenced defense firms, they explained.
Despite these caveats, the authors argue that their findings have clear implications for political economy and policymaking. “The uneven buildup of defense-related investments across Europe highlights substantial differences in perceived geopolitical risk, which may complicate coordinated policy responses, particularly in light of EU initiatives to strengthen defense capabilities and foster collective rearmament. Patterns in financial markets may therefore provide useful insights for policymakers, offering early signals of emerging threats that can help guide defense planning and alliance coordination.” The study authors also emphasize that it would be valuable to further explore how European rearmament initiatives influence private investment behavior, and whether public policy amplifies or dampens these responses. “Finally, applying this approach to other geopolitical contexts could help determine whether financial markets consistently act as early-warning signals, or whether the patterns observed are specific to Europe and the Russia–Ukraine conflict,” they concluded.
Image: Official portrait of Ukrainian President Volodymyr Zelenskyy