
Why Philadelphia Matters: A Study Reveals Hidden Environmental Risks for People with Disabilities
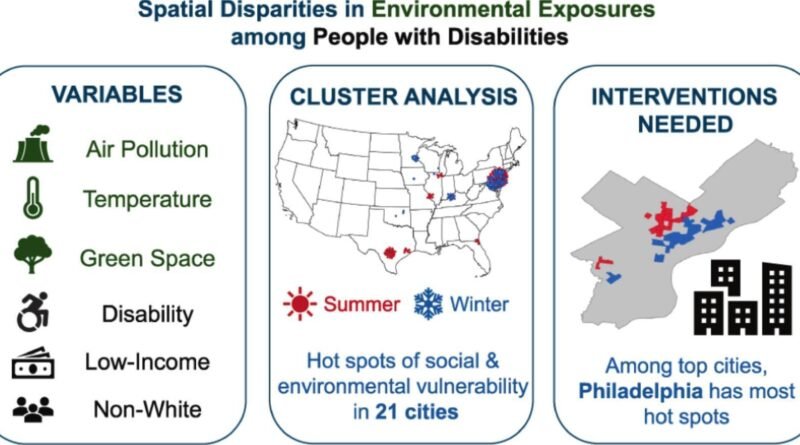
This study examines environmental injustice toward people with disabilities in the United States by analyzing their exposure to air pollution, lack of green space, and extreme temperatures throughout the year. Numerous urban hotspots reveal that in major cities, people are exposed to significantly higher levels of pollution and heat stress. The main conclusion is that urban policies often overlook the specific needs of people with disabilities, especially during winter, and that fairer urban planning is necessary to better protect the most vulnerable groups.
Environmental justice is most often examined through well-mapped patterns of inequality: poverty, race, and spatial marginalization. However, this perspective does not capture all dimensions of vulnerability that shape exposure to environmental hazards. More recent research has begun to address a less visible but crucial angle of this issue: disability. In this context, the term “eco-ableism” has emerged, describing how people with disabilities are often excluded from environmental planning and public policy design, despite the specific vulnerabilities that shape their everyday lives.
“The eco-ableism scholarship largely focuses on recreational green spaces, such as parks. In the United States, many recreational green spaces are located far away from or are inaccessible to disabled visitors, despite the 1990 Americans with Disabilities Act (ADA) that aims to safeguard individuals with disabilities from discrimination.”
“If people with disabilities are excluded from green spaces, then they are unable to access the therapeutic and social benefits that contribute to a better quality of life.”
A recent study, “Seasonal green space, air pollution, and temperature in the United States: Spatial disparities among people with disabilities,” led by Sandy Wong from Ohio State University, further addresses this gap by analyzing three key environmental factors: the seasonal distribution of green space, air quality, and temperature for individuals with disabilities in the contiguous United States. The authors of the study are Sandy Wong, Arrianna Marie Planey, Johnathan Rush, and Allan C. Just.
As the authors explain, the study area is the contiguous United States, which includes the lower 48 states and Washington, D.C; all census tracts across the rural-to-urban continuum were included in the analysis. Since both extreme heat and cold can have serious health consequences and exacerbate existing conditions, the researchers examine summer (May–September) and winter (November–March) separately. The study also includes disability alongside race and socioeconomic status, providing a more comprehensive view of environmental inequality patterns.
At first glance, the national-level results may appear surprising. Areas with higher proportions of people with disabilities, on average, also have more green space. However, the authors emphasize that this does not indicate environmental equity, but rather reflects population distribution patterns: disability is more prevalent in rural areas and in parts of the southeastern United States, where the built environment is less dense and natural vegetation is more abundant. Similarly, at the national level, no clear associations were found between disability prevalence and either PM2.5 levels or average temperatures, suggesting that broad averages may mask more complex local patterns.
Hotspots of vulnerability
To uncover what these averages conceal, the researchers applied spatial analysis to identify clusters in which multiple environmental risks overlap. These “hotspots of vulnerability” reveal a different picture. A total of 169 clusters were identified across 21 U.S. cities, 78 in summer and 91 in winter, where high proportions of people with disabilities coincide with low green space, high air pollution, and extreme temperatures.
Many of these clusters are concentrated in the Mid-Atlantic region. Summer clusters, associated with extreme heat, are most common in cities such as San Antonio (26 clusters), Philadelphia (23), Houston (7), and Chicago (6). Winter clusters, associated with extreme cold, are particularly pronounced in Philadelphia (36), Baltimore (14), Louisville (12), and Camden (11). These hotspots differ substantially from national averages: while people with disabilities make up about 12% of the U.S. population overall, their share rises to approximately 23% within these clusters.
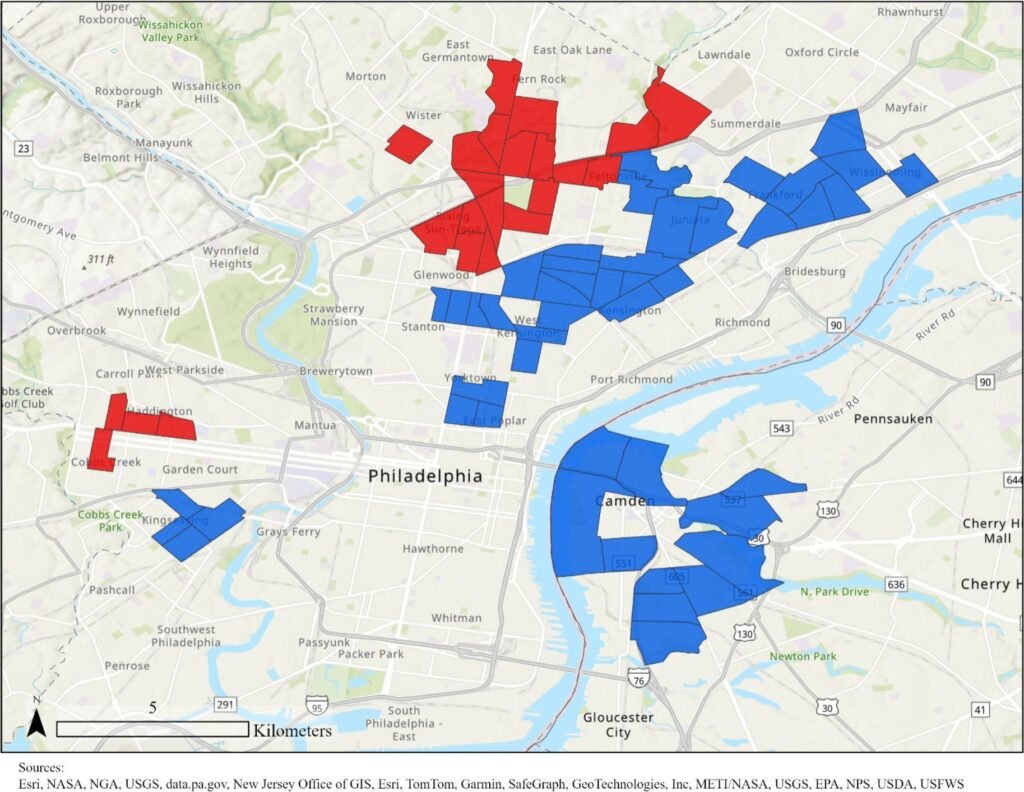
Philadelphia stands out as the only city with prominent clusters in both summer and winter. An analysis of the city’s climate policies reveals a gap: although resilience strategies such as tree planting and reducing the urban heat island effect are in place, they are almost entirely focused on mitigating summer heat. Protection against extreme cold is largely absent, despite the fact that winter clusters outnumber summer ones. As the authors note, “Philadelphia has been previously identified as having significant clusters of high disability and low greenness in the year 2010 (Wong et al., 2023), and these findings reveal that these patterns have persisted nearly a decade later.”
The study has several limitations
As the authors highlight, the study has several limitations: “First, we focus on environmental exposures based on residential location. While this may be where many disabled people spend much of their time, some individuals may spend a portion of their time elsewhere for work, leisure, or other purposes. Further inquiry is needed on how activity spaces influence personal exposure to environmental factors. Second, we include all individuals with disabilities. Additional investigation is needed to identify differential exposure based on disability type, as people with physical disabilities may have different experiences than those with cognitive impairments. At the same time, the ACS data have varying degrees of error. To explore this direction, census geographies may need to be aggregated from tracts to counties. Third, the data we used likely underestimates disability prevalence as the Census Bureau measures disability among the noninstitutionalized population, and individuals with disabilities are a hard-to-reach demographic. Lastly, our data and analyses only reveal cross-sectional trends and correlations in the year 2021. Future studies should compare trends between different time periods or leverage longitudinal designs to better understand changes and causal relationships over time.”
Understanding the specific vulnerabilities of people with disabilities is becoming essential, as such localized inequalities remain invisible without detailed spatial analysis. As the study shows, recognizing these patterns is a crucial first step toward developing more equitable and effective public policies, policies in which people with disabilities are not a neglected group, but active participants.